
Heavy rains have disrupted normal life in Uttarakhand, a Himalayan state of India. Lot of tourists/pilgrims are stranded around temples at these places due to flooding and continuous downpour. We often associate summer with a season to travel, in India however summer brings Monsoon with it. So it’s not the best weather for traveling, however most of the religious events take place during these months as the mountains are inaccessible during winters. For example every year millions of pilgrims visit shrines like Kedarnath, Badrinath, Hemkund Sahib. This year a record rainfall has damaged these temples and has caused an emergency in the state.

Mt. Kailash
Another pilgrimage which heads to Mt. Kailash and Mansarovar lake, also happens during the same time. This is one of the highly coveted trip and there are very few permits issued each year. Mt. Kailash being in China requires lot of process and dealing with red tape. There is an application process and a lottery is drawn for selection process.
Given the bad weather right now I was wondering how this trip was progressing. Travelers (Yaatri’s) are sent in different batches for logistical reasons. Each batch consists of around 60 people. Interestingly enough I found a list of this years yaatri’s on ministry of external affairs website. List includes their name, age and father’s name. I thought of playing around and draw some statistics. Ideally this data should have been private and not disclosed as it contains personal information.

age distribution
1. Average age of travelers
Mean is around 47 years with Standard deviation of 11 years. Oldest person is around 70 years old and youngest being 19 years.

most common first names
2. Most common first names
There are 21 people with first name Ramesh followed by Rajesh and Sunil. We can infer these names were popular among the masses when people with the mean age were born.

most common last name

most common father’s last name
3. Most common Last names
Patel’s have a majority with 118 people with this last name, followed by Sharma, Kumar and Gupta. When we tried to find most occurring fathers last name we find Singh taken top spot. For a while it looked amusing but when manually checked against the data set, we find there is a big ambiguity on how we write a name in India. In north people prefer to write their first name followed by middle and last. In central and west last name precedes the first name. In south there is nothing like last common name, it’s your name followed by fathers/husbands name. On some occasions there is grandparents name also added to it. So we do not have a consensus on how to write a name. In above case we found lot of people have written their last name followed by first names in their fathers name category.
birthdays
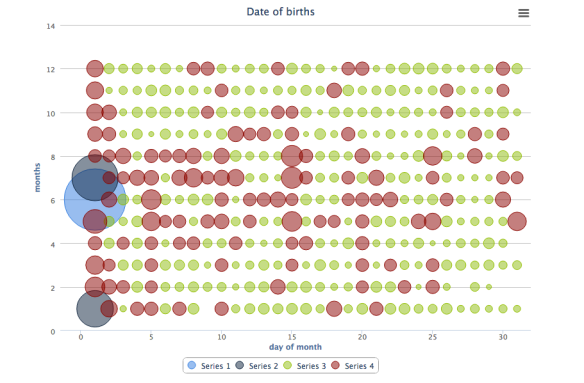
4. Birthdays
Many people seem to share birthdays, with as many as 28 people sharing 7 among them. Interestingly 62 people have their birthdays as 01-June followed by 01-July and 01-January (different years). In probability theory if we pick random values from a pdf they have to be independently and identically distributed, which doesn’t look the case here. It is possible that birth date present in these documents are not real but given later when official records were prepared. If we look at the plot we see first of each month look more likely day than any other in that month. We see lot of people born around June/July month. One analogy behind this could be that most schools open during this time. For a lot of people this could to be the first instance when they needed to officially declare their date of birth. So first of June becomes the most likely day.
5. Relations
We can also find out relationships in this dataset. In some parts of India women change their name after marriage. They put their husbands first name as their middle name. In South people generally have firstName and LastName. LastName is their fathers/husbands first name. So in a way we can create a whole ancestry tree if we have all the names and date of birth information. We tried to use this rule and check if we find any relations. Surprisingly all such relations appear in order in this list. We can also use age difference to find if this is a paternal relation as kids use their fathers name as their middle name too. This rule is however less applicable to North Indian names, in such cases we used last names in order and age difference in order to see if it represents a group. Inherent in our society there is a caste system. People usually marry in same caste or religion. We also tried to find a compatible last name pair which represent a common caste or group. However due to ambiguity in representation of father’s name we used both first and last name in the pair. From the results we can actually see such a pattern forming.
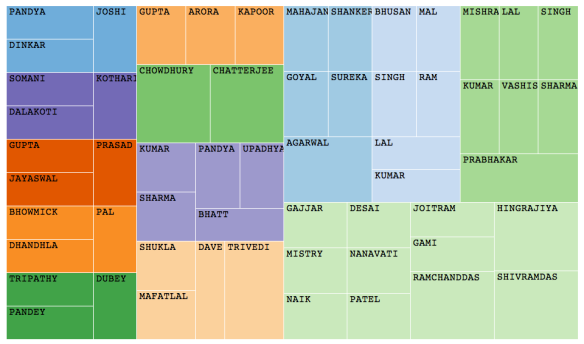
social cluster after inference from data
Sadly enough as we hear the latest news, batches 2-10 of Mansarovar pilgrimage have been cancelled this year due to bad weather.
In case you want to do further analysis on this set.You may follow this Starter code.


